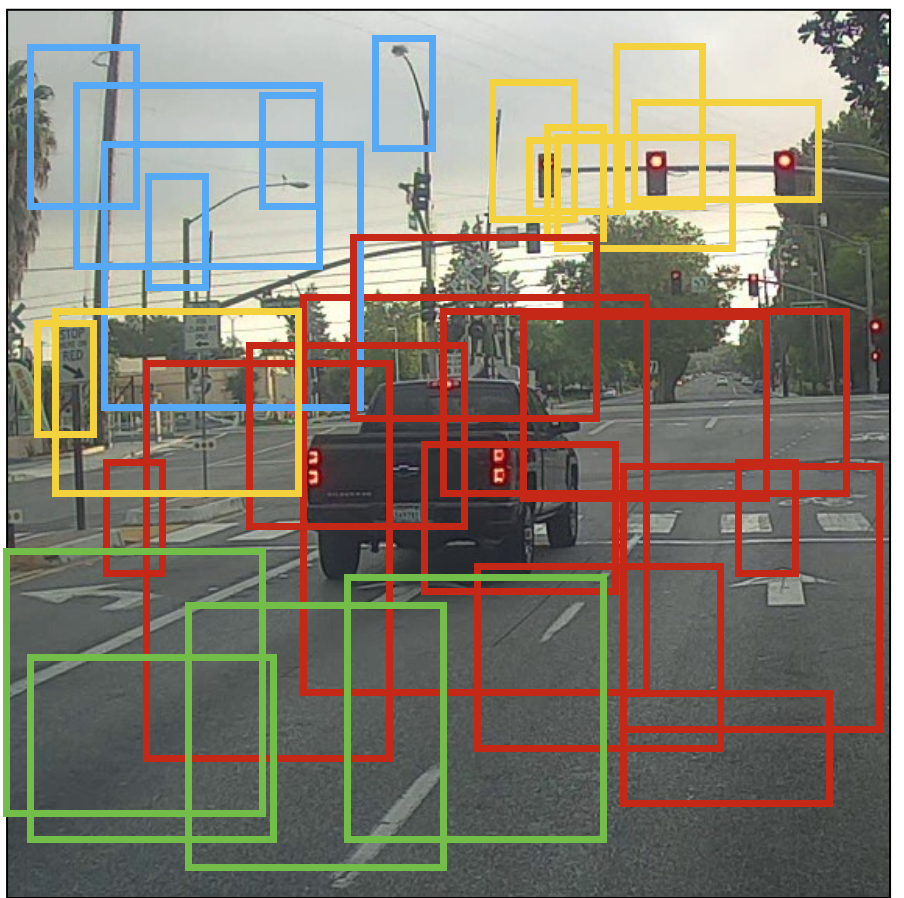
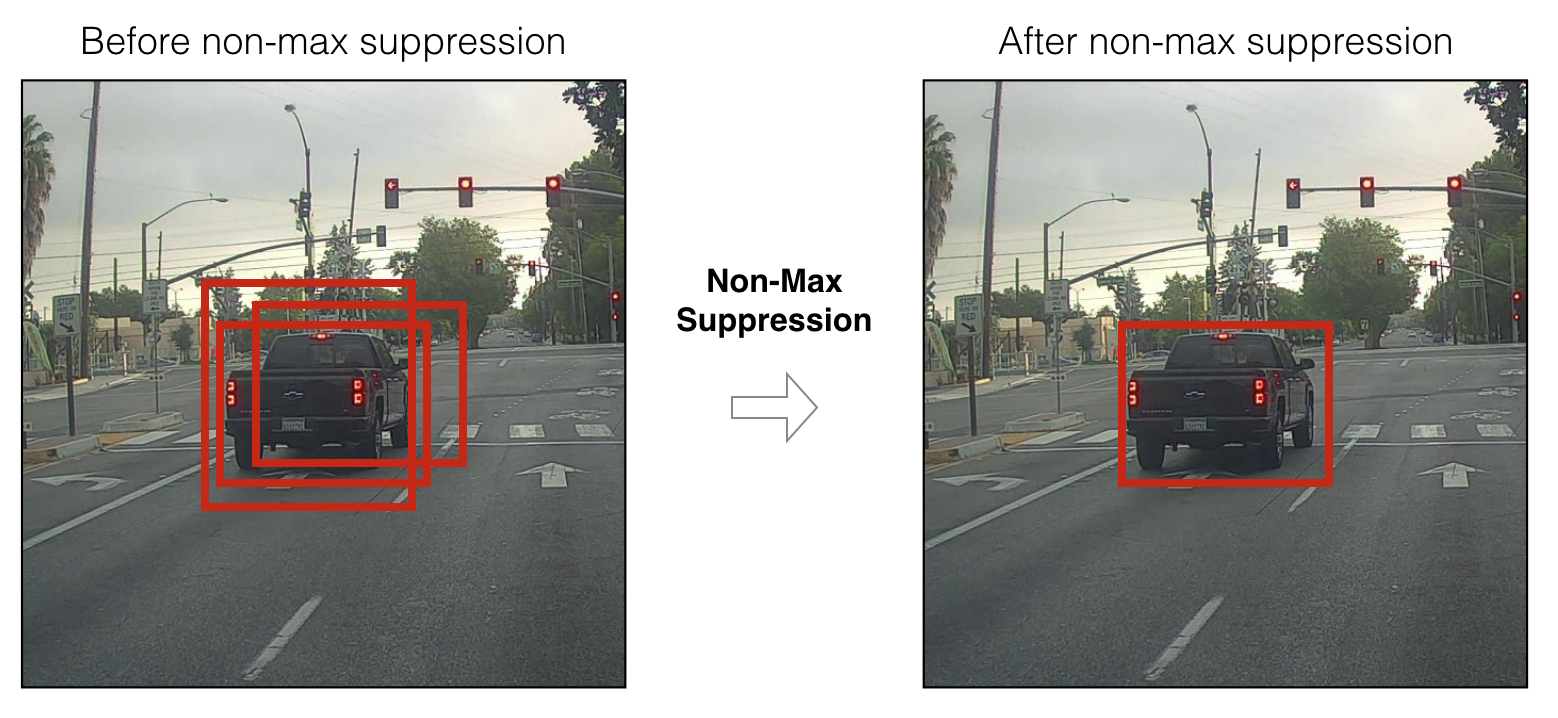
____________________________________________________________________________________________________
Layer (type)                     Output Shape          Param #     Connected to
====================================================================================================
input_1 (InputLayer)             (None, 608, 608, 3)   0
____________________________________________________________________________________________________
conv2d_1 (Conv2D)                (None, 608, 608, 32)  864         input_1[0][0]
____________________________________________________________________________________________________
batch_normalization_1 (BatchNorm (None, 608, 608, 32)  128         conv2d_1[0][0]
____________________________________________________________________________________________________
leaky_re_lu_1 (LeakyReLU)        (None, 608, 608, 32)  0           batch_normalization_1[0][0]
____________________________________________________________________________________________________
max_pooling2d_1 (MaxPooling2D)   (None, 304, 304, 32)  0           leaky_re_lu_1[0][0]
____________________________________________________________________________________________________
conv2d_2 (Conv2D)                (None, 304, 304, 64)  18432       max_pooling2d_1[0][0]
____________________________________________________________________________________________________
batch_normalization_2 (BatchNorm (None, 304, 304, 64)  256         conv2d_2[0][0]
____________________________________________________________________________________________________
leaky_re_lu_2 (LeakyReLU)        (None, 304, 304, 64)  0           batch_normalization_2[0][0]
____________________________________________________________________________________________________
max_pooling2d_2 (MaxPooling2D)   (None, 152, 152, 64)  0           leaky_re_lu_2[0][0]
____________________________________________________________________________________________________
conv2d_3 (Conv2D)                (None, 152, 152, 128) 73728       max_pooling2d_2[0][0]
____________________________________________________________________________________________________
batch_normalization_3 (BatchNorm (None, 152, 152, 128) 512         conv2d_3[0][0]
____________________________________________________________________________________________________
leaky_re_lu_3 (LeakyReLU)        (None, 152, 152, 128) 0           batch_normalization_3[0][0]
____________________________________________________________________________________________________
conv2d_4 (Conv2D)                (None, 152, 152, 64)  8192        leaky_re_lu_3[0][0]
____________________________________________________________________________________________________
batch_normalization_4 (BatchNorm (None, 152, 152, 64)  256         conv2d_4[0][0]
____________________________________________________________________________________________________
leaky_re_lu_4 (LeakyReLU)        (None, 152, 152, 64)  0           batch_normalization_4[0][0]
____________________________________________________________________________________________________
conv2d_5 (Conv2D)                (None, 152, 152, 128) 73728       leaky_re_lu_4[0][0]
____________________________________________________________________________________________________
batch_normalization_5 (BatchNorm (None, 152, 152, 128) 512         conv2d_5[0][0]
____________________________________________________________________________________________________
leaky_re_lu_5 (LeakyReLU)        (None, 152, 152, 128) 0           batch_normalization_5[0][0]
____________________________________________________________________________________________________
max_pooling2d_3 (MaxPooling2D)   (None, 76, 76, 128)   0           leaky_re_lu_5[0][0]
____________________________________________________________________________________________________
conv2d_6 (Conv2D)                (None, 76, 76, 256)   294912      max_pooling2d_3[0][0]
____________________________________________________________________________________________________
batch_normalization_6 (BatchNorm (None, 76, 76, 256)   1024        conv2d_6[0][0]
____________________________________________________________________________________________________
leaky_re_lu_6 (LeakyReLU)        (None, 76, 76, 256)   0           batch_normalization_6[0][0]
____________________________________________________________________________________________________
conv2d_7 (Conv2D)                (None, 76, 76, 128)   32768       leaky_re_lu_6[0][0]
____________________________________________________________________________________________________
batch_normalization_7 (BatchNorm (None, 76, 76, 128)   512         conv2d_7[0][0]
____________________________________________________________________________________________________
leaky_re_lu_7 (LeakyReLU)        (None, 76, 76, 128)   0           batch_normalization_7[0][0]
____________________________________________________________________________________________________
conv2d_8 (Conv2D)                (None, 76, 76, 256)   294912      leaky_re_lu_7[0][0]
____________________________________________________________________________________________________
batch_normalization_8 (BatchNorm (None, 76, 76, 256)   1024        conv2d_8[0][0]
____________________________________________________________________________________________________
leaky_re_lu_8 (LeakyReLU)        (None, 76, 76, 256)   0           batch_normalization_8[0][0]
____________________________________________________________________________________________________
max_pooling2d_4 (MaxPooling2D)   (None, 38, 38, 256)   0           leaky_re_lu_8[0][0]
____________________________________________________________________________________________________
conv2d_9 (Conv2D)                (None, 38, 38, 512)   1179648     max_pooling2d_4[0][0]
____________________________________________________________________________________________________
batch_normalization_9 (BatchNorm (None, 38, 38, 512)   2048        conv2d_9[0][0]
____________________________________________________________________________________________________
leaky_re_lu_9 (LeakyReLU)        (None, 38, 38, 512)   0           batch_normalization_9[0][0]
____________________________________________________________________________________________________
conv2d_10 (Conv2D)               (None, 38, 38, 256)   131072      leaky_re_lu_9[0][0]
____________________________________________________________________________________________________
batch_normalization_10 (BatchNor (None, 38, 38, 256)   1024        conv2d_10[0][0]
____________________________________________________________________________________________________
leaky_re_lu_10 (LeakyReLU)       (None, 38, 38, 256)   0           batch_normalization_10[0][0]
____________________________________________________________________________________________________
conv2d_11 (Conv2D)               (None, 38, 38, 512)   1179648     leaky_re_lu_10[0][0]
____________________________________________________________________________________________________
batch_normalization_11 (BatchNor (None, 38, 38, 512)   2048        conv2d_11[0][0]
____________________________________________________________________________________________________
leaky_re_lu_11 (LeakyReLU)       (None, 38, 38, 512)   0           batch_normalization_11[0][0]
____________________________________________________________________________________________________
conv2d_12 (Conv2D)               (None, 38, 38, 256)   131072      leaky_re_lu_11[0][0]
____________________________________________________________________________________________________
batch_normalization_12 (BatchNor (None, 38, 38, 256)   1024        conv2d_12[0][0]
____________________________________________________________________________________________________
leaky_re_lu_12 (LeakyReLU)       (None, 38, 38, 256)   0           batch_normalization_12[0][0]
____________________________________________________________________________________________________
conv2d_13 (Conv2D)               (None, 38, 38, 512)   1179648     leaky_re_lu_12[0][0]
____________________________________________________________________________________________________
batch_normalization_13 (BatchNor (None, 38, 38, 512)   2048        conv2d_13[0][0]
____________________________________________________________________________________________________
leaky_re_lu_13 (LeakyReLU)       (None, 38, 38, 512)   0           batch_normalization_13[0][0]
____________________________________________________________________________________________________
max_pooling2d_5 (MaxPooling2D)   (None, 19, 19, 512)   0           leaky_re_lu_13[0][0]
____________________________________________________________________________________________________
conv2d_14 (Conv2D)               (None, 19, 19, 1024)  4718592     max_pooling2d_5[0][0]
____________________________________________________________________________________________________
batch_normalization_14 (BatchNor (None, 19, 19, 1024)  4096        conv2d_14[0][0]
____________________________________________________________________________________________________
leaky_re_lu_14 (LeakyReLU)       (None, 19, 19, 1024)  0           batch_normalization_14[0][0]
____________________________________________________________________________________________________
conv2d_15 (Conv2D)               (None, 19, 19, 512)   524288      leaky_re_lu_14[0][0]
____________________________________________________________________________________________________
batch_normalization_15 (BatchNor (None, 19, 19, 512)   2048        conv2d_15[0][0]
____________________________________________________________________________________________________
leaky_re_lu_15 (LeakyReLU)       (None, 19, 19, 512)   0           batch_normalization_15[0][0]
____________________________________________________________________________________________________
conv2d_16 (Conv2D)               (None, 19, 19, 1024)  4718592     leaky_re_lu_15[0][0]
____________________________________________________________________________________________________
batch_normalization_16 (BatchNor (None, 19, 19, 1024)  4096        conv2d_16[0][0]
____________________________________________________________________________________________________
leaky_re_lu_16 (LeakyReLU)       (None, 19, 19, 1024)  0           batch_normalization_16[0][0]
____________________________________________________________________________________________________
conv2d_17 (Conv2D)               (None, 19, 19, 512)   524288      leaky_re_lu_16[0][0]
____________________________________________________________________________________________________
batch_normalization_17 (BatchNor (None, 19, 19, 512)   2048        conv2d_17[0][0]
____________________________________________________________________________________________________
leaky_re_lu_17 (LeakyReLU)       (None, 19, 19, 512)   0           batch_normalization_17[0][0]
____________________________________________________________________________________________________
conv2d_18 (Conv2D)               (None, 19, 19, 1024)  4718592     leaky_re_lu_17[0][0]
____________________________________________________________________________________________________
batch_normalization_18 (BatchNor (None, 19, 19, 1024)  4096        conv2d_18[0][0]
____________________________________________________________________________________________________
leaky_re_lu_18 (LeakyReLU)       (None, 19, 19, 1024)  0           batch_normalization_18[0][0]
____________________________________________________________________________________________________
conv2d_19 (Conv2D)               (None, 19, 19, 1024)  9437184     leaky_re_lu_18[0][0]
____________________________________________________________________________________________________
batch_normalization_19 (BatchNor (None, 19, 19, 1024)  4096        conv2d_19[0][0]
____________________________________________________________________________________________________
conv2d_21 (Conv2D)               (None, 38, 38, 64)    32768       leaky_re_lu_13[0][0]
____________________________________________________________________________________________________
leaky_re_lu_19 (LeakyReLU)       (None, 19, 19, 1024)  0           batch_normalization_19[0][0]
____________________________________________________________________________________________________
batch_normalization_21 (BatchNor (None, 38, 38, 64)    256         conv2d_21[0][0]
____________________________________________________________________________________________________
conv2d_20 (Conv2D)               (None, 19, 19, 1024)  9437184     leaky_re_lu_19[0][0]
____________________________________________________________________________________________________
leaky_re_lu_21 (LeakyReLU)       (None, 38, 38, 64)    0           batch_normalization_21[0][0]
____________________________________________________________________________________________________
batch_normalization_20 (BatchNor (None, 19, 19, 1024)  4096        conv2d_20[0][0]
____________________________________________________________________________________________________
space_to_depth_x2 (Lambda)       (None, 19, 19, 256)   0           leaky_re_lu_21[0][0]
____________________________________________________________________________________________________
leaky_re_lu_20 (LeakyReLU)       (None, 19, 19, 1024)  0           batch_normalization_20[0][0]
____________________________________________________________________________________________________
concatenate_1 (Concatenate)      (None, 19, 19, 1280)  0           space_to_depth_x2[0][0]
                                                                   leaky_re_lu_20[0][0]
____________________________________________________________________________________________________
conv2d_22 (Conv2D)               (None, 19, 19, 1024)  11796480    concatenate_1[0][0]
____________________________________________________________________________________________________
batch_normalization_22 (BatchNor (None, 19, 19, 1024)  4096        conv2d_22[0][0]
____________________________________________________________________________________________________
leaky_re_lu_22 (LeakyReLU)       (None, 19, 19, 1024)  0           batch_normalization_22[0][0]
____________________________________________________________________________________________________
conv2d_23 (Conv2D)               (None, 19, 19, 425)   435625      leaky_re_lu_22[0][0]
====================================================================================================
Total params: 50,983,561
Trainable params: 50,962,889
Non-trainable params: 20,672
____________________________________________________________________________________________________
